Monitoring for cyanobacteria is a process of routinely observing or measuring these organisms through space and time. Cyanobacteria monitoring can serve many purposes, such as guiding outreach and education, tracking HCB progression and trends, meeting regulatory requirements, helping recreational users and others avoid contact with HCBs, or supporting decision-making processes and management actions. This section is focused on monitoring specifically for benthic cyanobacteria. We encourage you to also read Section 4 of the HCB-1 guidance (ITRC 2021) for additional information on monitoring and for a discussion of methods that are used to monitor planktonic cyanobacteria.
Similar to planktonic HCBs, time and personnel needed to monitor for benthic cyanobacteria can be considerable. It is important to identify your goals and intended outcomes. Often, these are outlined in a cyanobacteria response plan (see Section 5) or a cyanobacteria management plan (see Section 1.5). You should consider your methods and sampling frequency carefully so that you can achieve your intended outcomes successfully, effectively, and economically. As always, consistent long-term data are necessary to better understand the local ecosystem, support public health response, and identify management approaches.
Unlike planktonic HCBs, benthic cyanobacteria may not always appear as an extensive area covered by a layer of biomass. Instead, benthic HCBs often are growing as small distinct mats that may be present over a large area. Sampling one mat may miss additional material in the vicinity, giving the wrong impression regarding the presence or absence of benthic HCBs. In contrast to planktonic species, benthic HCBs are often (but not always) attached to something and less likely to move with wind and wave conditions. Once the presence of a benthic cyanobacteria has been identified in a location, there is a higher likelihood that subsequent monitoring of that location will continue to find the HCB.
This section provides information you can use to select field and laboratory methods that evaluate benthic cyanobacteria and the cyanotoxins they may produce. We provide a general overview of the method and considerations for its use, and include links to resources that can offer you the opportunity to explore the method in more detail. These methods are typically used to evaluate conditions in inland surface waters such as lakes, ponds, rivers, and streams. Although some may be applicable for use inside drinking water facilities, we recommend that you consult the resources provided in Section 5.2.3 of the HCB-1 Guidance (ITRC 2021) for more information.
3.1 Developing a Monitoring Plan for Benthic Cyanobacteria and Their Cyanotoxins
A successful cyanobacteria monitoring program always begins with the development of a monitoring plan. It is important to identify your goals and have an understanding of cyanobacteria ecology when deciding how you will monitor. Your monitoring strategy should support your cyanobacteria response and communication plan. It may also support your water body cyanobacteria management or watershed nutrient control plan by evaluating how cyanobacteria communities or cyanotoxins respond to management activities.
In contrast to monitoring for planktonic HCBs, which are often initiated in response to visual indication of a bloom, benthic HCBs may be invisible to an observer at the surface and require you to focus proactively specifically on the benthic zone.
Benthic cyanobacteria communities are structurally very different from planktonic communities. They usually form distinct mats, layers, or gelatinous colonies that can be quite firm (see the Visual Guide for photos). These are typically located below the water surface and may be overlooked by the casual observer. Benthic blooms have much more limited mobility while attached. Pieces of these benthic communities can detach from their original location, however, and move with water flow or currents just like planktonic HCBs (see Section 1.3.4).
Benthic cyanobacteria can also produce cyanotoxins, and different sampling and laboratory methods are required to monitor cyanotoxins versus cyanobacteria themselves. Benthic cyanobacteria may be present, but not actively producing cyanotoxins. Conversely, cyanobacteria mats may be absent, hard to find, or hidden in filamentous green algae, yet cyanotoxins can still be detected in the water column. Monitoring for benthic cyanobacteria and their cyanotoxins therefore has additional considerations when compared to monitoring for planktonic HCBs:
Environmental indicators–Benthic HCBs grow in a wide variety of habitats and under a wide range of water conditions. The typical planktonic HCB indicators of high nutrient levels and calm water conditions may not apply to these organisms. Benthic HCBs can occur in low nutrient waters with high transparency, under low light conditions, and under moderate flow conditions in streams and rivers. See Section 1 for more information.
Appearance of benthic HCBs–Benthic HCBs have many growth forms and colors. They can be formed by single cyanobacteria species and have a uniform appearance when growing rapidly. However, they often are found in mats that include other algae, bacteria, mosses, sediment, sand, and debris where they may not be the dominant organism. Coloring and appearance can vary widely as a result. If you suspect the presence of a cyanotoxin- or taste/odor-producing cyanobacteria, you will want to evaluate these mixed mats as well.
Attached mats–Benthic HCBs may form biofilms (very thin layers of biological material) or mats on a variety of substrates such as sediment, rock, and plants (see Section 1.3.2). This will determine which field collection method you use. Collection methods are typically appropriate for one or two types of substrate only and will be ineffective when used elsewhere.
Spatial distribution–Benthic cyanobacteria and cyanotoxins, like planktonic HCBs, may not be evenly distributed around your water body. The source of dissolved cyanotoxins may be obvious or there may be more than one source. See Section 2 for more information. Even when confined to a particular location, benthic HCBs can vary in thickness and composition, may be growing in patches rather than a large single mat or layer, and may be growing on many surfaces (or substrates) like rock or plants.
Determining extent of mat–Detached benthic HCBs can move quite a distance from their original location under certain conditions, yet also continue to grow at the original location (see Section 1.3.4). You may need to look upstream/upwind or in a different area of the water body to fully understand how much is present.
- Recognizing that different assemblages may exist at different depths, benthic HCBs may be located well below the water surface if good clarity allows for deep light penetration.
- Scouring flow can distribute benthic material throughout the entire stretch of water between upstream/upwind and downstream/downwind sites. This material can serve as “seed” for a new benthic mat in these locations.
- Areas that have experienced benthic HCBs are likely to have them again.
Deciding when a benthic community may be a concern–Benthic cyanobacteria mats can be present but overlooked or they can be a prevalent part of the benthic algal community. Representative samples will need to be collected from the different mats observed in an area where a benthic HCB is suspected. Your response plan should outline the information you need to decide that a benthic HCB is of concern. For example:
- Microscopy (Section 3.3.3.4) or pigment analysis (Section 3.3.3.2) can be used to confirm the presence or absence of benthic cyanobacteria. This may be sufficient to indicate a possible health concern and trigger next steps in testing or public outreach.
- Once benthic cyanobacteria are identified, mat extent (Section 3.2.3.1) and percent cover (Section 3.2.3.2) may assist in evaluating risk. Your cyanobacteria response plan may use mat extent or percent cover threshold to trigger the next steps in testing or outreach (for example, New Zealand Ministry for the Environment and Ministry for Health 2009).
- Like planktonic HCBs, not all benthic cyanobacteria produce cyanotoxins and it is not possible to tell whether cyanotoxins are present without testing. Mats in the same vicinity can contain both cyanotoxin- and non-toxin-producing taxa. Cyanotoxins can be detected even when cyanobacteria are not the dominant organisms found in a mat. Your response plan should outline guidance values that indicate when cyanotoxin concentrations in the mat or in the water above it are a health concern (see Section 5).
- Dissolved cyanotoxins may be present at several locations in the water. Several methods can be used to detect cyanotoxins; see Section 3.3.4 for details on individual detection methods. Methods for cyanotoxins are unable to differentiate between those produced by a benthic species versus a planktonic species, so it’s important to keep in mind that simply monitoring for cyanotoxins will not help you locate the source.
- Different methods for detecting cyanotoxins may give results in different units of measurement, for example µg/L or ng/g. It is important to understand which method will give you results that are directly comparable to recreation and drinking water action levels outlined in your cyanobacteria response plan.
Event response and bloom confirmation versus monitoring–The same methods used for long-term monitoring are used during the initial event response and bloom confirmation of a suspected HCB. Confirmation of a benthic HCB and/or cyanotoxins does not automatically mean that you need a comprehensive monitoring program. For example, the observation of a limited area covered by a mat or in a location that has no public access may not warrant this effort. Instead, initial sampling followed by public outreach may be sufficient.
Identifying your data needs–Your HCB response plan outlines the data needed for risk assessment and communication purposes. It is important to select field and laboratory methods that meet these data needs.
- Descriptive/non-numerical information like presence/absence, taxonomic identification, photographs, and estimated extent of benthic HCB coverage may be sufficient to meet your needs. Surveys for benthic HCBs often incorporate these non-numerical approaches.
- Numeric data are often required for specific action such as closing beaches or beginning a drinking water facility response. Numeric data may also be important for long-term monitoring of HCBs to evaluate trends or response to management activities aimed at reducing HCB occurrence. Make sure that you are familiar with the methods, the type of data they produce, and detection limits so that you can select the ones that meet your HCB response plan or management plan requirements.
Collecting benthic HCB samples–Getting a representative sample of a benthic HCB is important. When mats are small, collecting individual samples from one to two locations may be sufficient to characterize it. However, larger mats or those with variable appearance will require more samples.
- The overall complexity of the ecological mosaic is not often captured with limited sampling coverage (Carmichael and Gorham 1981, Wood, Kuhajek, et al. 2012). Cyanotoxin production within a single mat can be extremely variable, even within and between short distances in the same mat. Collecting a number of individual samples, compositing a portion of each, and homogenizing into a single sample for analysis may be a good first step. If composite samples indicate levels of concern, the individual samples would be available for further analysis.
Biomass or volume–Cell density or abundance of planktonic HCBs is usually quantified by volume (for example as cells/mL). Results from benthic HCB analyses are often quantified by cell count or biomass (cells/cm2 or µg cyanotoxin per gram wet or dried mat). Your response plan and advisory threshold requirements will specify the kind of data required to trigger response to benthic HCBs (see Section 5), and you should select methods that will provide the appropriate data. You may also want to standardize the area sampled each time, for example using a known area (see Figure 3.1).
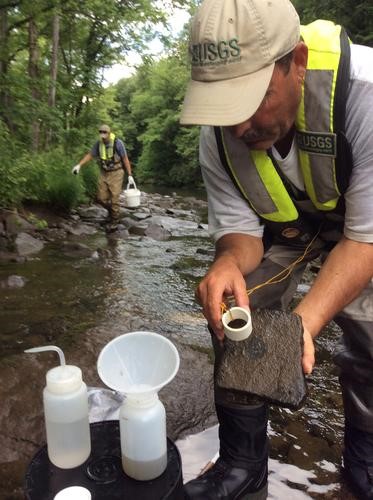
Figure 3‑1. Geological Survey (USGS) scientist using a section of PVC pipe to collect standardized periphyton sample.
Source: Celeste Journey, USGS, public domain.
Monitoring costs–Costs can increase quickly when benthic HCBs are extensive or persist over a long period of time, so you will need to balance available resources with the level of information required to meet your HCB response plan goals. There is no single test for all cyanotoxins, and laboratories often charge an individual fee to analyze each different cyanotoxin. They will also charge different amounts depending on whether your sample is whole water, algal material, or tissue, because sample preparation can be significant for some types of tissue. It’s important to determine which cyanotoxin is to be tested for to meet your HCB response plan needs.
- You may consider developing a stratified monitoring plan that focuses on a small number of key locations and then increase the number of sites or tests when benthic HCBs or cyanotoxins are confirmed at the key locations.
For additional information on formulating a monitoring plan for benthic cyanobacteria, please also see Toxic Cyanobacteria in Water (Chorus and Welker 2021).
3.1.1 Monitoring in Streams and Rivers
Unlike planktonic cyanobacteria, which often form highly visible surface blooms, benthic cyanobacteria are not easily recognized by most observers or can be obscured by growth of other algae or aquatic plants. There are currently few programs around the United States and elsewhere that specifically focus on monitoring for benthic cyanobacteria blooms in streams and rivers.
Many states do routinely monitor benthic algal communities in general and identify their constituent organisms (for examples, see ME DEP 2019, NYS DEC 2019). These programs have historically been focused on filamentous green algae and their impact on recreation (Suplee et al. 2009) while also evaluating the presence of other algae and cyanobacteria by determining the amount of substrate they cover (Section 3.2.3.2). It is possible to evaluate change in the cyanobacterial community over time using these survey approaches (as well as their historical data) and, with greater awareness of health concerns due to toxicity, cyanobacteria-focused testing can be incorporated into these routine sampling events.
Rivers and streams support a variety of uses that may be affected by benthic cyanobacteria, including recreation (swimming, tubing, boating, fishing) and serving as drinking water sources. Physical disruption of the mats during recreation or high flow events can release cyanotoxins and move mat fragments downstream or up on to the shoreline. As you develop a monitoring program for your river or stream, you will want to consider users at the known locations of benthic mats, as well as those downstream, and the kind of information that is important for each user group (see Section 5).
Goals of a benthic sampling program in flowing waters might be to:
- Quickly screen and identify parts of a stream/river that might have benthic cyanobacteria. This might be a one-time event to assess the potential for benthic blooms.
- Routinely monitor for benthic cyanobacteria at specific set reaches or sampling locations on a predetermined schedule. These surveys can be used to look for changes in the cyanobacteria community over time to evaluate change in habitat, response to management, or other purposes.
- Target response to reports of benthic mats, detached mats, or dried “chips” found on shore. You may also wish to look for benthic cyanobacteria if there is an unexplained dog death that occurred after being in the area or a cyanotoxin detection with no visible planktonic bloom.
Any of these approaches could be used to:
- Evaluate potential impacts to a specific use such as recreation or drinking water.
- Examine the benthic community as a whole and determine the presence/absence of cyanobacteria within the benthic algal community.
- Track the benthic cyanobacteria community over time, potentially using established transects.
- Find “hotspots” to include in future monitoring events.
Benthic cyanobacteria can be widely distributed in flowing water habitats as well as their adjacent pools and backwaters. It is important to choose multiple locations in which to look for cyanobacteria mats. Land use can create zones of increased nutrients, loss of canopy/shading, or increased sedimentation along the river or stream, which may influence benthic growth. Also, habitat changes—different substrate types and their availability, flow velocity, water temperature and depth—might affect the growth and abundance of cyanobacteria mats. The location of recreational activities should also be considered.
In general, higher nutrients, greater substrate stability, and good water clarity support increased growth of benthic algal communities in flowing waters. However, Heath et al. (2013) found that Phormidium mats grew well with moderate concentrations of dissolved phosphorus and nitrogen in streams, while Wood et al. (2017) found that concentrations of dissolved reactive phosphorus above 0.005 mg/L had significant negative effects on Phormidium cover. Internal cycling within mats may also provide the needed nutrients for growth (Wood, Wagenhoff, and Young 2014).
Monitoring for benthic HCBs in flowing environments often occurs in response to an event like a dog death or human illness, when time is of the essence. Grab samples (Section 3.2.4.1) typically provide the initial information needed by health officials. Available local resources and subsequent public health data requirements then shape the approach used for future monitoring. See Section 3.1.3 and Appendix B for examples of monitoring approaches that were developed in response to the discovery of benthic cyanobacteria mats.
3.1.2 Monitoring in Lakes
Phytoplankton productivity in lakes is directly related to the availability of nutrients. Although planktonic HCBs are typically associated with eutrophic conditions in lakes, cyanobacteria mats in lakes occur across a wide range of nutrient conditions. Benthic cyanobacteria are frequently found in oligotrophic environments (Smith et al. 2012, Wood, Kuhajek, et al. 2012). Mez, Hanselmann, and Preisig (1998) demonstrated that toxic-producing benthic cyanobacteria were well adapted to oligotrophic conditions in lakes with high variability in environmental conditions. Oligotrophic lakes typically have low phytoplankton biomass, which contributes to higher penetration of light to the bottom. Under conditions of abundant light and low levels of water-column nutrients, benthic algal assemblages are often growing close to available substrate and relatively inconspicuous (Hawes and Smith 1994, Lowe 1996). See Section 1.3 for more information on the ecology and growth of benthic HCBs.
Littoral zones, where light penetrates to the bottom, contain much of the primary producer biodiversity in lakes, and act as the interface between the terrestrial and aquatic system by capturing nutrients from the land (Vadeboncoeur and Power 2017). Littoral habitats encompass all of the nearshore area in a lake, have high recreation potential for humans, and easy access for dogs and other animals. Littoral zones also support abundant aquatic plant growth, which can serve as a substrate for attached cyanobacteria. Despite the high usage, littoral zones are some of the least routinely monitored areas (Vander Zanden and Vadeboncoeur 2020). In recent years, an increasing number of freshwater lakes have reported benthic HCBs in the littoral zone (Belykh et al. 2017, Smith et al. 2012).
Similar to planktonic cyanobacterial blooms, benthic HCBs are not uniformly present throughout a water body, and one location rarely is representative of conditions elsewhere. Sampling for benthic HCBs should provide the data needed for evaluation of health concerns connected to activities of concern such as swimming or drinking water production. In lakes, littoral zones often exhibit high concentrations of planktonic HCBs when compared to open water locations due to wind or wave action. Detached benthic mats may also accumulate there for the same reasons while also growing elsewhere. Because benthic HCBs and circumstances vary, lake managers will need to identify appropriate locations in the water body and collection types to best meet monitoring objectives.
Lakes may support the growth of both planktonic and benthic HCBs. If cyanotoxins are present, dissolved cyanotoxins may be released from one or both sources. To determine where a cyanotoxin originates, you may need to conduct careful targeted sampling of both benthic and planktonic material. Analysis of the benthic mat or surface scum should indicate which is releasing the dissolved cyanotoxin. See Section 2.3 for more information.
To establish temporal patterns and spatial distribution of benthic HCBs in lakes or reservoirs, open water and shallow sites should be targeted to fully characterize the system. Unless cyanobacterial mats have become detached and floated up, they can be hard to detect. Wind and wave action can push the surfaced mats from the open water to the shoreline. Such variability means that full characterization of a water body will require multiple sampling locations and often the use of more than one sampling method. See the next section for examples of monitoring plans used for benthic HCBs in lakes.
3.1.3 Examples of Monitoring Plans for Benthic HCBs
Monitoring plans should meet local needs for cyanobacteria response and be tailored to individual water bodies. No single approach is appropriate for all waters. Here we present several examples of existing monitoring programs and outline a generic approach that might be used to respond to a first report of a benthic HCB or build a monitoring program.
Example 1: Surface Water Ambient Monitoring Program (SWAMP), statewide, California
Purpose: On-going routine monitoring of planktonic and benthic biomass for cyanotoxins to assess human health risks and need for posting advisories (Figure 3-2).
Sites: Shorelines or beaches; open water areas used for full-body contact recreation; bays, coves, lagoons, or backwater areas; and all publicly accessible water bodies.
Frequency: Varies with location and recreation intensity. Sampling to be conducted routinely during periods of high recreational use, daily or weekly.
Methods:
- Grab sample (Section 3.2.4.1) for cyanotoxins:
- algal material and scums, reported as milligrams cyanotoxin/kilogram biomass (mg/kg) dry weight.
- whole water, reported as micrograms/liter (µg/L).
- depth-integrated sample (multiple types), reported as µg/L (see Section 4.4.1.2 in HCB-1(ITRC 2021)
- Grab samples (Section 3.2.4.1) for identification and biomass estimation: algal mat material and scums
- Cyanotoxin analysis by ELISA or LC-MS (see Section 3.3.4.2)
Additional information: SWAMP (2017a); Howard, Fetscher, and Nagoda (2016); and the CA HABs Incident Report Map (CCHAB 2021d).
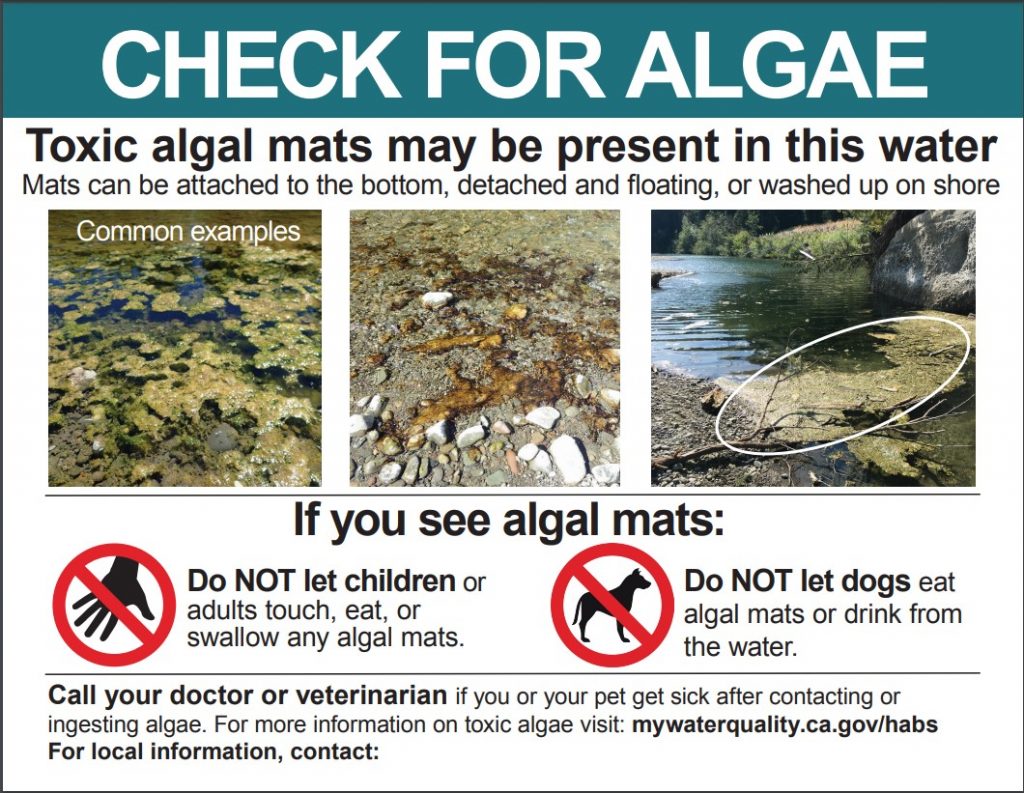
Figure 3‑2. Notification signage used in California for benthic HCBs.
Source: CA Cyanobacteria and Harmful Algal Bloom Network. Public Domain.
Example 2: Lower Colorado River Authority, Austin, Texas
Purpose: Determine whether cyanotoxins are present year-round in the Highland Lakes, Austin, TX (Figure 3-3).
Sites: Open water and shallow cove sites within lakes and drinking water reservoirs where elevated cyanotoxins had been found during a preliminary study.
Frequency: Monthly for one year starting in 2022.
Methods:
- Cyanotoxins
- Grab sample (Section 3.2.4.1): algal material, reported as micrograms cyanotoxin/milligram biomass (µg/mg)
- Grab sample: whole water, reported as nanograms cyanotoxin/milliliter (ng/mL)
- Passive sampling (Section 3.2.4.9) using SPATT bags, reported as nanograms per gram resin (ng/g)
- Cyanotoxin analysis: LC-MS (see Section 3.3.4.2)
- Cyanobacteria species identification
- Microscopy (Section 3.3.3.4) for species identification
- Pigments (Section 3.3.3.2)
- Relative phycocyanin concentration (RFUs)
Additional information: Appendix B.3, Lake Travis Case Study.
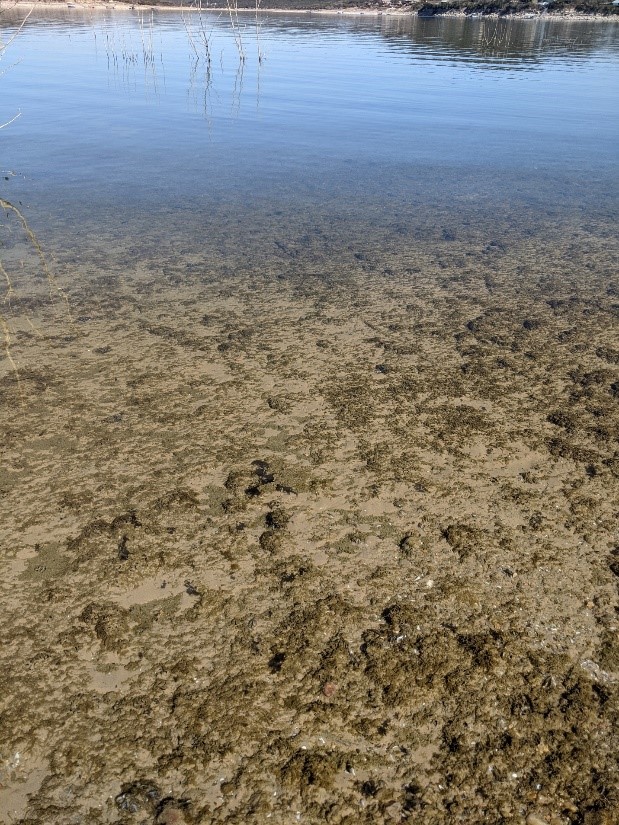
Figure 3‑3. Lake Travis, Texas, during a period when confirmed cyanotoxins were present despite no visual planktonic HCB. February 2021.
Source: Lower Colorado River Authority.
Example 3: Monitoring a benthic bloom in the Russian River, California
Purpose: Routine monitoring to track benthic HCB status and inform public health communication.
Sites: Recreational areas and beaches along the Russian River (Figure 3-4)
Frequency: Varies with location and conditions
Methods:
- Visual assessment (Section 3.3.3.1)
- Cyanotoxins
- Grab sample (Section 3.2.4.1) whole water, reported as micrograms/liter (µg/L)
- Cyanotoxin analysis: enzyme-linked immunosorbent assay (ELISA, Section 3.3.4.2).
Additional information: Appendix B.1, Russian River Case Study
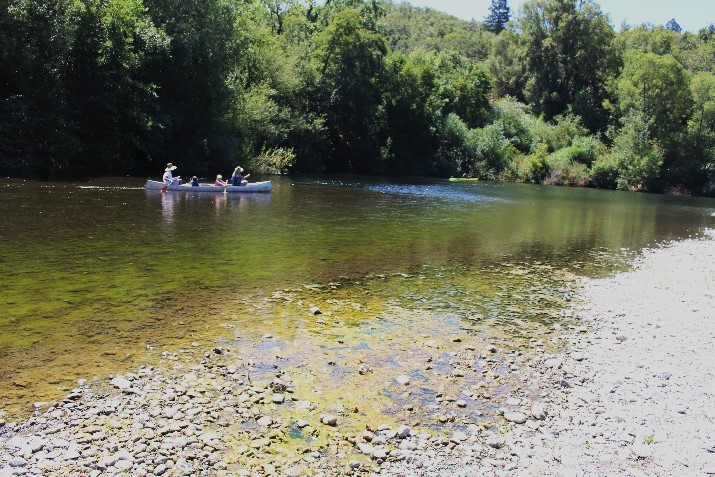
Figure 3‑4. Russian River, California.
Source: Keith Bouma-Gregson.
Example 4: Monitoring a benthic bloom in Zion National Park, Utah
Purpose: Monitor ecology and recreational impacts of a benthic HCB in the park
Sites: Three main branches of the Virgin River (Figure 3-5) where elevated cyanotoxin levels had been found in a preliminary study.
Frequency: Monthly, changing to biweekly when field conditions indicate increasing HCB presence.
Methods:
- Visual assessment (Section 3.3.3.1): Scan location for the presence of visible HCB mats
- Cyanotoxins
- Grab sample (Section 3.2.4.1): water and mat material after using “benthic disturbance” method (Appendix B.2-6), reported as micrograms cyanotoxin/liter water (µg/L)
- Passive sampling (Section 3.2.4.9) using SPATT bags, reported as nanograms per gram resin (ng/g)
- Cyanotoxin analysis: anatoxin-a by LC-MS (Section 3.3.4.2)
- Cyanobacteria species identification
- Microscopy (Section 3.3.3.4) for species identification
Additional information: Appendix B.2, Zion National Park Case Study.
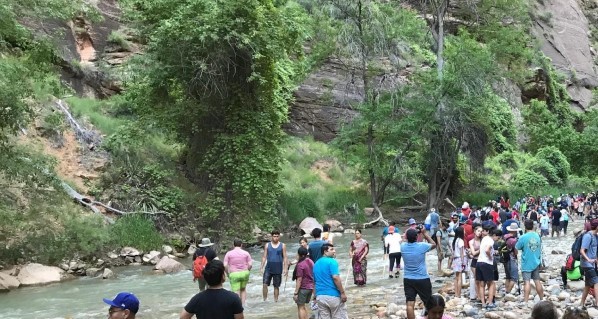
Figure 3‑5. Visitors at the Virgin River, Zion National Park, Utah. The benthic disturbance method developed by the National Park Service mimics disruption of benthic mats by heavy recreation.
Source: Utah Department of Environmental Quality.
Example 5: Generic monitoring approach for a benthic HCB that can be tailored to meet your needs
Monitoring plans will vary with the HCB event and the information you need to get from your sampling effort. The questions in Table 3-1 will help you formulate a monitoring plan.
Table 3‑1. Monitoring plan considerations
| Questions to Consider | Options | Other considerations |
| What type of water body is affected? | Still water (lakes, ponds, Section 3.1.2). Flowing (streams, rivers, Section 3.1.1). | Water body uses. |
| What should be sampled? | Cyanotoxins (Section 3.3.4) or cyanobacteria (Section 3.3.3). | You may want to sample both to determine which taxa and which cyanotoxins are present. |
| Where do you expect to find it? | Mats may be over sediment, attached to plants or hard substrates, or floating in the water. See Section 1.3.2 for more information. | See examples of benthic HCBs in the Visual Guide. |
| How large an area is affected? | Determine mat extent (Section 3.2.3.1) and/or percent cover (Section 3.2.3.2). | Mat distribution can be patchy and they may originate upstream of report location. |
| How often will you collect samples? | One-time confirmation sample, short-term monitoring, routine surveillance. | You will need to consider available resources and local or state requirements. |
| How will you collect samples | There are many options. See Table 3-2 and Section 3.2.4. | Resources, turn-around time, and number of samples may influence which method you choose. |
3.2 Field Collection Methods for Benthic HCBs
The methods that you use to monitor benthic HCBs and the location where samples are collected are important aspects of your monitoring program. You might need multiple approaches or a tiered approach to achieve your program’s objectives. Information found elsewhere in this document will help you design your event response sampling or monitoring program to meet the goals of your benthic HCB response plan (Section 5) and your HCB management plan (Section 1.5).
3.2.1 Field Safety, Sampling Equipment, and Sample Preservation
Your monitoring plan should outline safety measures that staff and others will use to reduce the risk of exposure to cyanotoxins. See Section 5 and the Visual Guide for more information. In general, you should avoid contact with suspected cyanobacteria scums and mats by wearing protective gear. Minimize exposure to potential aerosols whenever possible.
It is important to review the analytical methods you are using for potential cross-contamination or environmental interferences so that you can take the necessary steps to reduce these. For example, it is very easy to cross-contaminate samples for molecular techniques such as PCR with genetic material from another sampling location or poorly cleaned equipment. You may need to clean equipment in the field between samples or have several clean samplers available. Type of bottle may also be important for some analytical methods. Make sure you understand what is required by the methods you have chosen so you obtain good quality data.
Your samples begin to change and degrade immediately after you have collected them, so appropriate sample preservation is very important. Sample preservation will vary with the analytical method. For some methods, placing on ice in a cooler may be sufficient. For others, dry ice or other rapid-acting coolant is needed. Preservatives are often very specific to the method. For example, Lugol’s iodine solution is often used for samples that will be evaluated using microscopy; however, it should not be used for samples that will be analyzed using PCR. If you intend to examine benthic HCBs using both these methods, you will need to use two sample containers and preserve them differently. Again, it is important to use the correct preservation for your samples to ensure that the analytical data are of good quality.
3.2.2 Maintaining Appropriate Documentation
Metadata are the pieces of information that document specific background conditions relevant to your monitoring and sampling efforts. Metadata informs other scientists who have not been involved in your program how you collected samples as well as how you analyzed and stored the resulting data. It may help them understand differences in results that may be caused by artifacts such as changing or updating an analytical method or even using a different type of sample bottle. Maintaining this descriptive documentation is an essential aspect of your monitoring program. It is especially important for long-term monitoring programs that may use data produced by different analytical methods, different laboratories, or different analysts over time.
At a minimum, you should have metadata associated with the following aspects of monitoring benthic HCBs:
- Sample collection–Field records at a minimum should include date, time, site number or clear description of location, the type of sample collected, preservation method, and the name of the field staff. Additional information can include links to photographs taken at the site as well as other water quality data collected such as temperature and Secchi depth. Creating an electronic or paper field sheet that staff complete when collecting samples helps ensure that all the information is recorded consistently.
- Laboratory analysis–Records here should at least include a consistently identifiable name for the method, the laboratory that conducted the analyses, a sample name or number that links to the field data, date analyzed, and the analytical result with units clearly identified. Most labs will use a bench sheet to track samples, and many commercial labs have an electronic sample management system. Most laboratories also maintain detailed records on equipment function, quality control, methods used, and quality assurance steps. You may wish to ask for this information as well; however, sometimes laboratories do charge for some of this information.
Monitoring plans and quality assurance plans are essential for maintaining consistency and quality. See Section 4.2 in HCB-1 (ITRC 2021) to learn about how to develop your plan. It is important to review these plans frequently to be sure that they accurately outline what you are doing. Keep copies of older plans as part of your metadata collection. They can be invaluable when trying to understand how your samples were collected and analyzed in the past.
3.2.3 Special Considerations for Evaluating the Abundance of Benthic Cyanobacteria
Benthic cyanobacteria form dense tangles or mats also called biofilms, and may include other organisms such as filamentous green algae and diatoms, along with bacteria, polysaccharides, and fungal hyphae. Mats can detach from the substrate and be found floating in the water column or as “chips” washed up and dried out on beaches or docks.
Benthic HCBs are typically more cohesive and firmer than planktonic HCBs, making it easier to collect standardized samples that have a discrete consistent boundary (for example, see Moulton II et al. 2002, WA Ecology 2010, WV DEP 2018). That makes it possible to determine the area covered by the sample. Whenever possible, analytical results from benthic mats should be reported based on the area of mat sampled, rather than by volume, as is typical for planktonic HCBs.
In addition, you will want to evaluate how much of the water body is affected (mat extent–Section 3.2.3.1) and how much of the substrate within the affected area actually has benthic mat present (percent cover–Section 3.2.3.2). Currently, only a few states or countries have thresholds for benthic cyanobacteria mats or guidance about the amount that represents a concern for human and environmental health (see Section 2.6 for examples).
3.2.3.1 Determining Mat Extent
Flowing water in rivers or streams, as well as wind and water currents in lakes, can move cyanobacteria around the water body. In the case of benthic HCBs, the main population and largest concentration of biomass may be upwind or upstream of the first reported location. To accurately evaluate the risk from a benthic HCB, you need to know much more may be present. Especially in flowing waters, benthic HCBs or their extracellular cyanotoxins can be carried a considerable distance downstream (see Zion River Case Study, Appendix B.2).
In small water bodies, it may be possible to do a foot survey along the shoreline to observe whether any additional deposit sites are present or where attached mats might indicate a likely origin site. Depending on water body size, a boat of some sort may be necessary. You may choose to do a visual assessment (Section 5.2.1) or use a field fluorometer (Section 3.3.3.2) to assist in confirming the presence of the benthic HCB. In rivers and streams, it may not be feasible to walk the entire length and you may need to limit your survey to those locations where you can access the water. Drones or other remote sensing techniques (Section 3.3.3.3) may be available for use. Your HCB response plan will help you prioritize locations that should be checked, such as public beaches and water intakes.
Creating a map or other image of documented HCB occurrence will help you understand the areal extent of observed benthic HCBs. New benthic mats can grow in places where small pieces may have been carried by the current and then settled to the bottom. These new colonies may be too small to observe during your survey so it should be assumed that benthic HCBs can be found in suitable habitat anywhere between the identified upstream/upwind and downstream/downwind sites. If you decide that routine monitoring is an appropriate next step, you may choose to sample at any site with suitable habitat to see whether cyanobacteria are present.
3.2.3.2 Coverage of Substrates
An important consideration for evaluating benthic HCBs is how much of the substrate is actually affected. If you are sampling cobble substrate in a river and they are abundant in a reach, yet just a small number are covered with cyanobacteria mats, your response may be different from what would occur if all the cobbles were covered by those mats. Cyanobacteria coverage in lakes and ponds may also be uneven.
Evaluating percent cover is a common approach used for vegetation surveys on the land and in the water. Benthic HCBs can also be quantified using this approach, which does not require you to count individual cells or filaments. Instead, you visually estimate how much of a known space is covered by the benthic mat. Coverage can be evaluated on a small area, using a 0.25 m quadrat, for example, or for the full width of a river or stream. Examples of approaches can be found in New Zealand’s periphyton monitoring manual (Biggs and Kilroy 2000), West Virginia’s field protocols (WV DEP 2018), Heath (2009), USEPA’s Rapid Periphyton Survey using a view bucket (Barbour et al. 1999), and Maine’s protocols for sampling algae (Danielson 2019).
The type of substrate available, as well as factors such as water movement and water depth, influence where you look for cyanobacteria. A study by Heath et al. (2013) examined seven locations along the River Hutt in New Zealand where Phormidium mats had been found and evaluated the habitat and abundance of the cyanobacteria. The most stable substrates—bedrock, boulder, and cobble—had the highest Phormidium coverage with averages of 91.7, 85.4 and 63.8 percent, respectively. The percent coverage decreased with decreasing substrate size where Phormidium on gravel, fine gravel, and sand ranged from 35.2-22.7 percent. They also observed growth to be affected by water velocity. Phormidium cover was highest with velocities between 0.6 and 1.1 m/s and decreased at greater than 1.1 m/s and less than 0.6 m/s.
3.2.4 Sample Collection Methods for Benthic HCBs
The methods discussed below are used to collect benthic HCB samples for evaluation using the analytical methods found in Section 3.3.3. Table 3-2 presents monitoring methods that can be used to sample benthic HCBs. The choice of method is determined by the type of HCB, the water body type, location, and water depth.
Table 3‑2. Field collection methods used to sample HCBs, by water body type and location.
| Field Method | Type of Sample | Type of Cyanobacteria | Water Body Type | Potential Locations | Water Depth Reached | |||||||||
| Cyanobacteria Biomass | Cyanotoxins | Planktonic | Benthic | Still Water | Flowing Water | Within Drinking Water Facilities | Shore Line | Mid-stream | Surface | Below Surface | Shallow <1 m |
Mid-depth >1 m–8 m |
Deep >8 m |
|
| Grab Sample | S | S | S | S | S | S | S | S | S | S | S | S | PS | PS |
| Periphyton Scrape | S | S | NS | S | S | S | S | S | S | S | S | S | PS | PS |
| Rake Sample | S | S | NS | S | S | PS | NS | PS | S | PS | S | S | S | PS |
| Ponar Sampler | S | S | NS | S | S | PS | NS | NS | PS | NS | S | S | S | S |
| Artificial Substrate | S | S | NS | S | S | S | S | S | S | NS | S | PS | S | S |
| Snorkel & SCUBA | S | S | NS | S | S | PS | NS | S | S | S | S | S | S | S |
| View Bucket & Bathyscope | PS | NS | NS | S | S | S | PS | S | S | NS | S | S | PS | NS |
| Sediment Coring | PS | PS | PS | PS | S | PS | NS | NS | PS | NS | S | NS | S | S |
| Passive Sampler | NS | S | S | S | S | S | S | S | S | S | S | S | S | S |
| Pigments via field sensor | S | NS | S | S | S | S | S | S | S | S | S | S | S | S |
3.2.4.1 Grab Samples
Grab samples require no specialized equipment to capture benthic HCBs. You can fill a container with water and detached benthic HCB mat, pick up a piece of mat from the shoreline, or collect a piece from the substrate to which it is attached. Grab samples can be used to collect material for rapid confirmation of benthic HCBs or as part of your routine monitoring program. To fully quantify data obtained from grab samples (cells/cm2, cyanotoxin µg/L, etc.), a known volume, area, or biomass must be collected. See also Section 4.4.1.1 in HCB-1 (ITRC 2021).
Several grab samples may be combined into a single container for analysis. These must be thoroughly mixed to create a representative composite sample for analysis. Composites may be used to reduce costs when evaluating a large number of samples collected over a large area. They may also be used to provide a representative sample from a small area with uneven benthic HCB coverage.
3.2.4.2 Periphyton Scrapes
If the sampling site is in a wadeable location with hard stable substrates (bedrock, cobble, sand, etc.) or aquatic vegetation, you can collect samples by scraping off material. Periphyton can also be scraped from the surface of firm plant roots, stems, and sometimes leaves. Some studies deploy artificial substrates and scrape new material from them (Figure 3-6). Examples of studies using periphyton scrapes include Griffith et al. (2009) and Danielson et al. (2011). See Section 4.4.2.1 in HCB-1 (ITRC 2021) for more information.
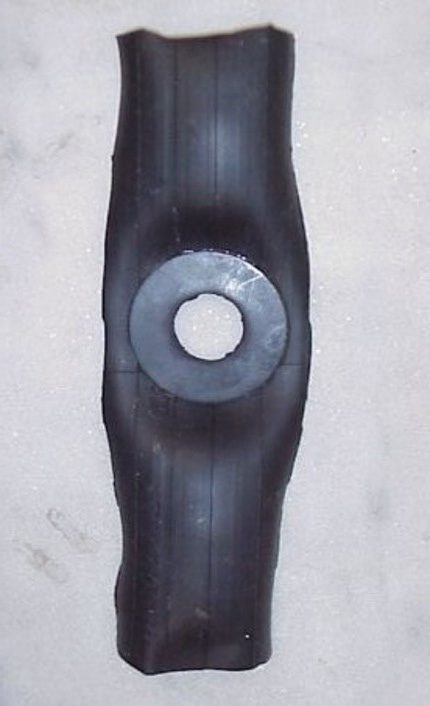
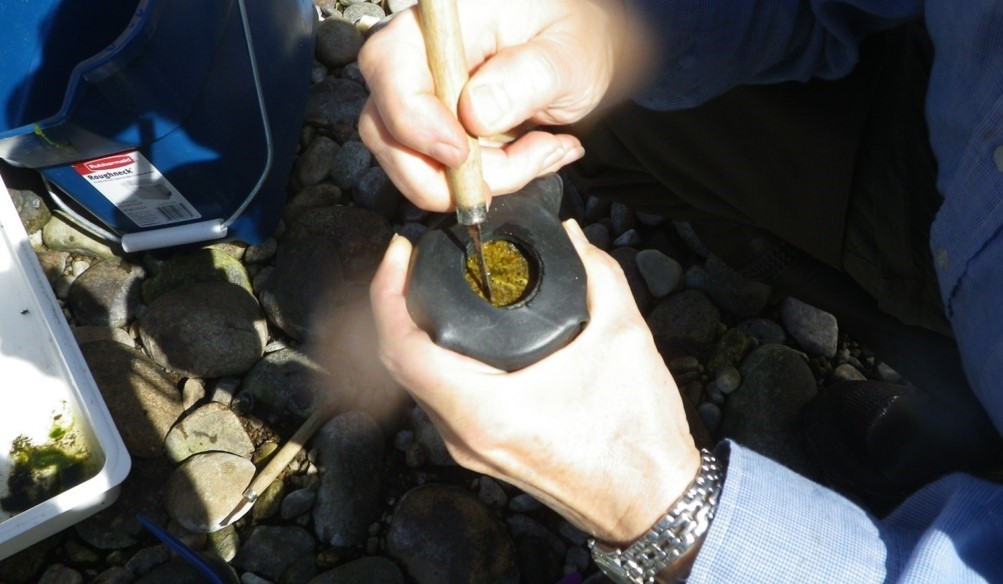
Figure 3‑6. Left–Periphyton scrape template made from a piece of rubber inner tube and reinforced with a metal washer. Right–Template in use.
Source: Joan Beskenis, Massachusetts Department of Environmental Protection.
3.2.4.3 Rake Samples
Rakes used for aquatic plant sampling can be used successfully with some types of benthic HCBs. See Section 4.4.2.2 in HCB-1 (ITRC 2021) for more information.
3.2.4.4 Ponar Samples
Ponar samplers (Figure 3-7) are mechanical dredges used to sample bottom substrates like sand, gravel, or clay. They can be used successfully to sample benthic HCBs in some environments. See HCB-1, Section 4.4.2.3 (ITRC 2021) for more information.
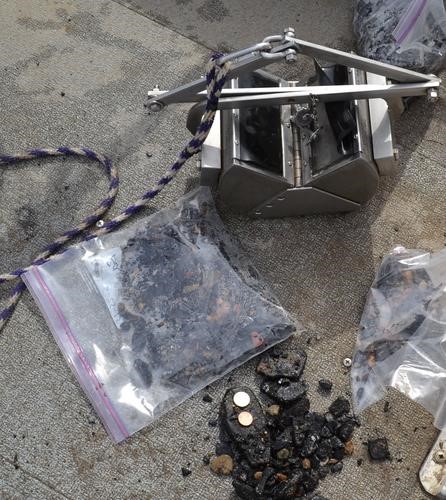
Figure 3‑7. Petit Ponar dredge and sample.
Source: Pat Braaten, USGS. Public Domain.
3.2.4.5 Artificial Substrates
Artificial substrates such as microscope slides or ceramic or plastic (PVC) plates have been used for many years to evaluate benthic algal community growth. These may be useful in providing uniform or consistent surface for algae to attach, allowing for comparison among sites. This may provide a better understanding of the potential for growth in these locations. See HCB-1, Section 4.4.2.4 (ITRC 2021) for more information.
3.2.4.6 Scuba and Snorkeling
In waters too deep to wade or to sample effectively from the surface, scuba and snorkeling may offer an option. See HCB-1, Section 4.4.2.5 (ITRC 2021) for more information.
3.2.4.7 View Bucket, Aquascope, and Bathyscope
These devices are intended to help you see below the surface of the lake or stream without interference from glare or waves. They come in a variety of styles and can also be constructed from easily obtained materials. Some bathyscopes have marked viewing faces that allow you to evaluate mat extent and cover of a known area. Look for these devices at water quality sampling equipment outlets and dive shops. You can also build your own bathyscope (see Figure 3-8). The bathyscope consists of a tub with a portion of the bottom replaced with plexiglass. A grid of dots is placed on the bottom plexiglass with a marker. In general, the bathyscope is used by recording the benthic material under each dot (biofilm, cobble, rock, cyanobacteria mats, filamentous algae, macrophytes, or moss), then tallying the information to determine percent cover of the different types. There are many sources online that provide directions. Examples of benthic sampling protocols using bathyscopes and view buckets include Danielson (2019), Kilroy et al. (2013), and New Zealand’s Periphyton Identification Guide (NIWA 2021).
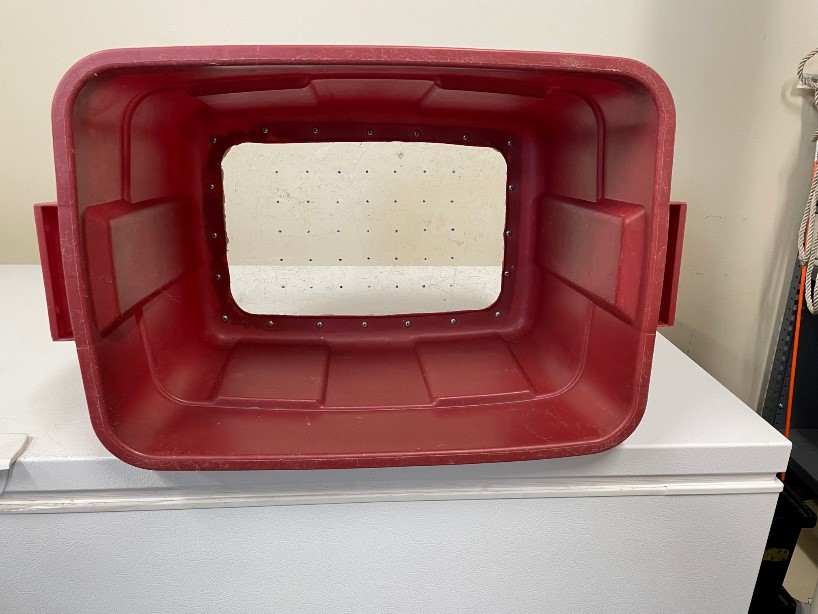
Figure 3‑8. Do-it-yourself bathyscope built from a large plastic tub.
Source: J. Beskenis, Massachusetts Department of Environmental Protection.
3.2.4.8 Sediment Coring
Total cell counts and DNA extracted from sediment can be used to infer cyanobacterial abundance for both benthic and planktonic cyanobacteria. Sediment cores taken from lake bottoms can be used to determine presence of dominant cyanobacterial communities (Savichtcheva et al. 2011), as well as past or present cyanobacterial abundance (Monchamp et al. 2016). On lakes with little or no monitoring data, sediment cores may be a source of historical information about past cyanobacteria abundance. They have also been successfully used to detect cyanotoxins in deeply buried sediment up to 4,700 years old (Henao, Rzymski, and Waters 2020).
Sediment cores are typically collected with a gravity sampler from multiple locations around a lake (Figure 3-9). The resulting core is sectioned into slices along its length. These slices correspond to different time periods in the lake as determined by a dating proxy (such as carbon dating), and may reflect trophic shifts in the lake over time (Giguet-Covex et al. 2010). The slices can be evaluated using different laboratory approaches like PCR and LC-MS after appropriate extraction.
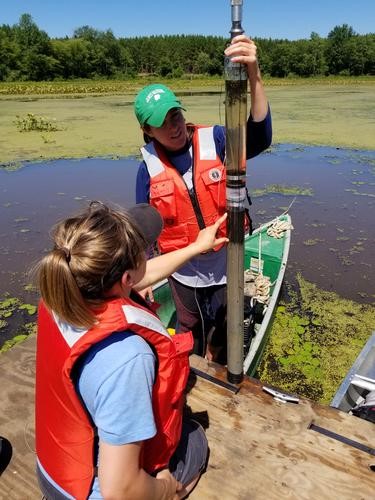
Figure 3‑9. Collecting a sediment core from Bearsden Pond, Virginia.
Source: USGS. Public Domain.
3.2.4.9 Passive Samplers for Cyanotoxins
Passive devices use an absorbent material to collect dissolved chemicals from the water column. In the case of cyanobacteria, these resins can be used to determine the presence or absence of dissolved cyanotoxins in water bodies. Passive samplers are also used to track other algal cyanotoxins in freshwater (Howard et al. 2018, Howard et al. 2017) and marine environments (Lane et al. 2010, Roué, Darius, and Chinain 2018). Resins are specific for certain types of chemicals, and you must use a resin capable of capturing the cyanotoxin of concern. See Lane et al. (2010) for more information on selecting resins.
One approach, solid phase absorption toxin tracking (SPATT), has been used successfully for detecting and tracking distribution of cyanotoxins. See HCB-1, Section 4.4.3 (ITRC 2021) for a general discussion about using SPATT to track cyanotoxins. Examples of using SPATT specifically for benthic HCB events are also found in Appendix B of this guidance.
When using passive samplers, it is important to note that cyanotoxin results are reported in nanograms cyanotoxin per gram resin (ng toxin/g). Kudela (2011) suggested a rough correspondence of 10:1 for resin concentration to grab sample values—for example, 10 ng/g captured via resin is roughly equal to 1 µg/L cyanotoxin in a water sample. These conversion factors would need to be developed for each location and experimental condition.
Passive samplers can only detect dissolved cyanotoxins in the water column and thus do not differentiate between cyanotoxins produced by benthic versus planktonic species. Cyanotoxins may be captured and then released from resins during longer deployment. Additionally, concentrations of cyanotoxin captured by resins are not directly comparable to most existing guidelines and threshold criteria. Because they capture only dissolved cyanotoxins, passive sampling methods cannot provide an estimate of exposure to intracellular cyanotoxins (see Section 2.4) for further information). See Roué, Darius, and Chinain (2018) for a review of SPATT technology.
3.3 Analytical Methods
3.3.1 Laboratory Safety
It is not possible to tell whether cyanotoxins are present in cyanobacteria samples that you bring back to the laboratory. Don’t leave your safety precautions in the field! All laboratory staff should handle samples containing potential cyanotoxins with care. In addition to wearing appropriate laboratory clothing, you should also take precautions to avoid exposure to aerosols that may be released during sample processing procedures like filtering and tissue grinding.
3.3.2 Laboratory Methods
The methods we present in this section provide information on benthic cyanobacteria abundance and concentration of cyanotoxins. We developed a set of criteria (see the read more option below) and an interactive monitoring method selection tool to help you review and select methods suited to your goals based on characteristics such as turnaround time and level of expertise required.
3.3.3 Methods to Evaluate Benthic Cyanobacteria Abundance
Table 3-3 provides an overview of sampling and assessment methods suitable to determine cyanobacteria abundance and taxonomic composition of benthic or attached cyanobacteria. For a more complete description of each method, use the hyperlink to access the appropriate section in our document. You can also use our interactive monitoring tool to explore monitoring methods.
Table 3‑3. Monitoring methods used to identify and enumerate cyanobacteria
| Methods for Identification and Enumeration | Result Type | Turnaround Time |
| Visual Assessments | Qualitative | <1 day |
| Pigments | Qualitative/quantitative | <1 day to 3 days (varies by method) |
| Remote Sensing | Qualitative/quantitative | <1 day to 1 day (varies by platform) |
| Microscopy | Qualitative/quantitative | <1 day |
| Genetic Methods for Identification | Quantitative | <1 day |
3.3.3.1 Visual Assessments
- Result: Qualitative
- Sampling type: Variable
- Turnaround time: <1 day
- Level of training: Novice to expert
- Laboratory required: No
- Relative cost: $-$$
- Benthic cyanobacteria presence/absence: Suitable
- Benthic cyanobacteria identification: Not suitable
- Benthic cyanobacteria abundance: Potentially suitable
- Cyanotoxin presence/absence: Not suitable
Visual assessments in the field consist of observing an area of a water body where benthic algae may be growing on sediments, rocks, plants, or other surfaces and then comparing these observations to a field guide for HCBs. Visual assessments require no special equipment and can provide a rapid qualitative evaluation of the presence of benthic cyanobacteria. With guidance materials and safety precautions, trained members of the public, citizen scientists, and community monitors can learn to recognize benthic HCBs that may pose a health risk.
It is very important to note that visual assessment for benthic cyanobacteria is much more difficult than for planktonic cyanobacteria and requires additional training. However, beginners can learn to recognize material that may be benthic cyanobacteria and therefore avoid contact with suspected HCBs when conditions change or when visiting water bodies that are not routinely monitored by trained staff. See Appendix A —Visual Guide—and our video on learning to recognize cyanobacteria blooms.
Pros and cons. Visual assessments are quick and inexpensive. Visual assessments are appropriate for benthic cyanobacteria; however, mats in deeper water will require different approaches (bathyscope, Section 3.2.4.7, or scuba, Section 3.2.4.6, for example). They require no specialized equipment and can provide information immediately. Identification of benthic cyanobacterial blooms will require specific training; however, visual assessments can be an important decision-making tool when the general public encounters a potential HCB in areas that are not routinely monitored. Visual assessments can be used to communicate with the general public about benthic HCBs (see examples in Appendix B). Large numbers of sites can be assessed using this method with reasonable cost. Visual assessments may be used to evaluate the presence or absence of benthic cyanobacteria, but they cannot provide information on the presence of cyanotoxins.
Training materials and reference photographs improve the consistency and accuracy of assessments made by the general public and stress safety precautions. Photographs provided by people recreating on or near water can be very useful, though they may require follow-up with the individual or a nearby partner organization. Many states provide options for the general public to send in such photos. Your response plan should outline basic required information and the steps that will be taken to confirm HCBs reported by the general public.
Although visual assessments are cost-effective, benthic HCBs and their cyanotoxins can be present when there is no visual indication of a bloom. Please see Appendix B.3 for an example. Please also read Section 4.3.1.1 of HCB-1 (ITRC 2021) for more information on the use of visual assessments.
The HCB team has developed a visual guide to help you recognize cyanobacteria and other aquatic phenomena you will find in water bodies. It includes both planktonic and benthic cyanobacteria.
3.3.3.2 Pigments
- Result: Qualitative to quantitative
- Sampling type: Point sampling
- Turnaround time: <1 day to 3 days
- Level of training: Intermediate
- Laboratory required: Field options available
- Relative cost: $$
- Benthic cyanobacteria presence/absence: Suitable
- Benthic cyanobacteria identification: Not suitable
- Benthic cyanobacteria abundance: Suitable
- Cyanotoxin presence/absence: Not suitable
Photosynthetic pigments can be used to determine whether benthic cyanobacteria are present and provide an estimate of how much is there. The most common pigments used for these evaluations are chlorophyll, phycocyanin, and phycoerythrin. Both laboratory analyses and field sensors are available. Please see HCB-1 Section 4.3.1.3 (ITRC 2021) for general information on the use of pigments for cyanobacteria evaluation.
Real-time field measurement of benthic cyanobacteria abundance requires a specialized fluorometric sensor. In contrast to the use of fluorescence sensors with planktonic blooms, which can be attached to buoys and other floating platforms, benthic sensors often have modifications to allow for their use against a solid substrate. Sensors typically detect one or two pigments, most often chlorophyll and phycocyanin.
New methods using pigments to quantify cyanobacteria and other photosynthetic organisms are in development. It is important to understand which pigment is measured by the sensor and the units used to quantify the data. Because of the changing amount of pigment per cell in different species, and with different light levels, the preferred approach for reporting pigment concentration is relative fluorescence units (RFU). For an example of field sensor use to evaluate benthic cyanobacteria and other periphyton, see NYS DEC (2019). Use of field sensors for photosynthetic pigments may not accurately evaluate biomass of thick benthic mats (Wood et al. 2020).
Laboratory measurements of pigments in benthic cyanobacteria use methods similar to those for planktonic HCBs – see Section 4.3.1.3 in HCB-1 (ITRC 2021). When submitting samples for laboratory analysis, be sure to record the amount sampled. This may be on an areal basis such as cubic centimeters or by wet/dry weight.
Pros and cons. Fluorometric sensors are easy to deploy and quickly provide quantitative information on benthic cyanobacteria density. Because pigment concentration changes with cell health and environmental conditions, concentrations are highly variable. In particular, pigment ratios and concentrations may vary greatly in benthic cyanobacteria cells growing deeper in the water column or under lower light.
Development of local thresholds for pigments facilitates rapid evaluation of current condition and appropriate response level. Sensors range widely in sensitivity, ease of use, and cost. Periodic calibration is necessary for quality assurance and standardization if more than one unit is deployed. Turbid conditions can result in interference.
3.3.3.3 Remote Sensing
- Result: Qualitative to quantitative
- Sampling type: Indirect
- Turnaround time: <1 day to 1 day
- Level of training: Intermediate to expert
- Laboratory required: No
- Relative cost: $
- Benthic cyanobacteria presence/absence: Potentially suitable
- Benthic cyanobacteria identification: Not suitable
- Benthic cyanobacteria abundance: Not suitable
- Cyanotoxin presence/absence: Not suitable
Water quality remote sensing platforms include satellite and airborne systems (manned and unmanned aircraft systems, drones), typically carrying imagers to measure reflected light energy (solar radiation) from the water surface and the upper part of the water column. See HCB-1 Section 4.3.1.4 (ITRC 2021) for more information.
At this time, remote sensing is typically not used to evaluate benthic cyanobacteria. One difficulty in using remote sensing in monitoring for benthic algae is that areal sensors rarely penetrate very far into the water column. It is very difficult to differentiate between bottom reflectance and benthic algae. However, remote sensing has been successfully used to monitor for Cladophora growth and submerged aquatic vegetation in the nearshore environments of the Great Lakes (MTRI 2017) and to monitor for stream algae (Kislik et al. 2020). Underwater drones may also offer an option for remote sensing of cyanobacteria mats (Rowan and Kalacska 2020).
3.3.3.4 Microscopy
- Result: Qualitative to quantitative
- Sampling type: Point sampling
- Turnaround time: <1 day
- Level of training: Intermediate to expert
- Laboratory required: Yes
- Relative cost: $$
- Benthic cyanobacteria presence/absence: Suitable
- Benthic cyanobacteria identification: Potentially suitable
- Benthic cyanobacteria abundance: Suitable
- Cyanotoxin presence/absence: Not suitable
Microscopy is used to identify benthic cyanobacteria; however, benthic cyanobacteria abundance is rarely evaluated using this method. Benthic HCBs are dense and tangled, making it difficult to prepare representative subsamples and important taxa may be overlooked. Identification of benthic cyanobacteria often requires a higher level of expertise as the distinctive characteristics are less obvious. Microscopy can provide a rapid confirmation that benthic cyanobacteria are present, but for a better understanding of mat composition, genetic identification methods provide more information. For more information on microscopic methods, see Section 4.3.1.5 in HCB -1 (ITRC 2021).
3.3.3.5 Genetic Methods for Identification
- Result: Quantitative
- Sampling type: Point sampling
- Turnaround time: <1 day
- Level of training: Intermediate
- Laboratory required: Yes
- Relative cost: $$
- Benthic cyanobacteria presence/absence: Suitable
- Benthic cyanobacteria identification: Suitable
- Benthic cyanobacteria abundance: Potentially suitable
- Cyanotoxin presence/absence: Not suitable
Genetic methods are used for the identification of benthic cyanobacteria, and these approaches can be powerful tools for understanding the complexity of these communities. Benthic HCBs may require different sample preparation methods, but in general are very similar to those used for planktonic HCBs. For a more complete discussion of these methods, please see HCB-1 Section 4.3.1.6 (ITRC 2021).
3.3.4 Cyanotoxin Testing
Cyanotoxin testing of benthic materials should be an integral part of your benthic cyanobacteria response plan. Like planktonic species, not all benthic cyanobacteria are able to produce cyanotoxins, and those that can do not always do so. It is not possible to visually distinguish a toxic benthic bloom from a nontoxic one. Similar to planktonic HCBs, the factors that drive cyanotoxin production are not well understood. Please refer to Section 2 for a discussion of cyanotoxins.
In the event of human or animal illness after potential exposure to cyanobacteria or cyanotoxins, specialized laboratories can perform confirmatory testing to identify cyanobacteria and cyanotoxins in feces, urine, stomach contents (if available), tissues, serum, and water specimens. This might be helpful for state and local health departments. For example, see Foss et al. (2019) on diagnosing microcystin intoxication in dogs and Dreher et al. (2019) on a recent livestock poisoning event in Oregon. Some states, such as California, may have lists of specialized laboratories that they make available (SWAMP 2021).
3.3.4.1 Preparation of Samples for Cyanotoxin Analysis
Cyanobacteria produce a wide variety of cyanotoxins. The mechanism by which they act on other organisms varies by cyanotoxin and is related to their chemical structure. Section 2 provides a detailed review of cyanotoxin properties. Here we review considerations for the preparation of cyanobacteria, water, or tissue for cyanotoxin analysis.
In general, water samples require little pre-analysis preparation. As the amount of planktonic or benthic biomass in a water sample increases, additional sample preparation steps may be needed. When testing for dissolved cyanotoxins, filtration can be used to remove biomass. When testing for total cyanotoxins in a sample with both water and cyanobacteria, a lysing step is typically used to break open the cells to release intracellular cyanotoxins. This may be a physical disruption of cells, such as repeated freeze/thaw cycles, or may use a chemical agent. In some cases, both physical disruption and chemical extraction are necessary. Examples of sample preparation of water for cyanotoxin analysis include USEPA Methods 544, 545, and 546 for microcystins and nodularins, cylindrospermopsin, and anatoxin-a, respectively (USEPA 2015f, e, 2016). Lysing and extraction are typically used when evaluating benthic or attached cyanobacteria.
There is increasing interest in the fate and transport of cyanotoxins, which requires an understanding of potential cyanotoxin accumulation (or lack of accumulation) in human, plant, and animal tissue. However, no single approach can be used to extract and detect all cyanotoxins in all tissues (Sundaravadivelu et al., in prep). It is important for you to review available literature and consult knowledgeable sources before selecting a sample preparation approach. Methods are improved and updated frequently. Current examples of cyanotoxin analysis in tissue include Al-Sammak et al. (2014), Chen et al. (2009), Dreher et al. (2019), Foss et al. (2019), and Gallo et al. (2009).
3.3.4.2 Selecting a Cyanotoxin Analysis Method
Benthic cyanobacteria may produce a variety of cyanotoxins, and mats may contain more than one kind. Current information suggests that most remain within the cells (intracellular) until they are damaged or begin to decay and leak cyanotoxins into the water (extracellular). However, there are exceptions, such as cylindrospermopsin, which is released from undisturbed healthy benthic mats (Section 2.4). Different methods are used to collect intracellular and extracellular cyanotoxins.
Table 3.4 summarizes the methods used for cyanotoxin monitoring. Methods are hyperlinked to the corresponding section of HCB-1 (ITRC 2021). Both benthic and planktonic taxa can be evaluated using these methods, though the sample preparation approach will not be the same. Considerations to note are:
- Strip tests and dipsticks will not be able to detect intracellular benthic cyanotoxins without cell lysis but can be used to evaluate dissolved extracellular cyanotoxins.
- The protein phosphatase inhibition assay (PPIA) is specific for microcystins and nodularins. It cannot detect the cyanobacterial neurotoxins that may be more abundant in benthic species.
- Primers and other tools for molecular study may not be available for use in genetic analyses of benthic cyanobacteria. Planktonic primers may not be appropriate for cyanotoxin detection in benthic taxa due to structural differences.
Table 3‑4. Methods used to identify and measure cyanotoxins
| Methods for Identification and Measurement | Result Type | Turnaround Time |
| Strip Tests/Dipsticks | Semiquantitative | <1 day |
| Protein Phosphatase Inhibition Assay (PPIA) | Quantitative | <1 day |
| ELISA | Quantitative | <1 day |
| Mass Spectrometry | Quantitative | 1–3 days |
| Chromatography | Quantitative | 1–3 days |
| Genetic Analysis for Cyanotoxins | Qualitative | 1–3 days |
3.4 Monitoring HCBs in the Future
Approaches to monitoring and analyzing for cyanobacteria and HCBs are rapidly changing. The basic information shared above is a place to start, but it is good to check for updates and new approaches regularly.
State agencies and other public health entities must often develop specific monitoring and sampling approaches in response to unique conditions during HCB events. State and federal cyanobacteria response plans can be good sources of information to learn more about these approaches.
Additional resources of potential interest include:
- Animal mortality sampling protocols (UT DEQ 2021c)
- New Zealand stream periphyton monitoring manual (Biggs and Kilroy 2000)
- USGS National Water-Quality Assessment (NAWQA) field protocols for stream sampling (Moulton II et al. 2002)
- The National Ecological Observatory Network (NEON) periphyton and phytoplankton sampling protocols (Parker 2018)
- USEPA list of laboratories analyzing for cyanotoxins (USEPA 2021g)
- The North American Lake Management Society (NALMS) Harmful Cyanobacteria Blooms web page provides an interactive map of HCB programs across North America (NALMS 2021).

